如何开发用于漏洞研究的Ghidra插件,Part 1

原文地址:https://www.somersetrecon.com/blog/2019/ghidra-plugin-development-for-vulnerability-research-part-1 概述 在今年3月5日举行的RSA安全会议上,美国国家安全局(NSA)发布了一个名为Ghidra的逆向工具。与IDA Pro类似,Ghidra也是一款反汇编和反编译软件,并提供了许多强大的特性
原文地址:https://www.somersetrecon.com/blog/2019/ghidra-plugin-development-for-vulnerability-research-part-1
概述
在今年3月5日举行的RSA安全会议上,美国国家安全局(NSA)发布了一个名为Ghidra的逆向工具。与IDA Pro类似,Ghidra也是一款反汇编和反编译软件,并提供了许多强大的特性,例如,插件支持、图形视图、交叉引用、语法突出显示等。虽然Ghidra的插件功能非常强大,但是介绍其完整功能的文章却非常匮乏。因此,在本系列文章中,我们将重点介绍如何开发Ghidra的插件,以及如何使用插件来帮助识别软件漏洞。
在上一篇文章中,我们利用了IDA Pro的插件功能来识别sink点(可能存在安全漏洞的函数或编程语法)。接着,我们在后续的文章中又对这种技术进行了改进,以识别内联strcpy调用和Microsoft Office中的缓冲区溢出漏洞。在本文中,我们将使用类似的技术和Ghidra的插件的各种特性来识别CoreFTPServer v1.2 build 505中的sink点。
Ghidra插件基础知识
在开始之前,大家最好先浏览一下示例Ghidra插件脚本和API文档的首页,以了解编写插件方面的基础知识。(Help -> Ghidra API Help)
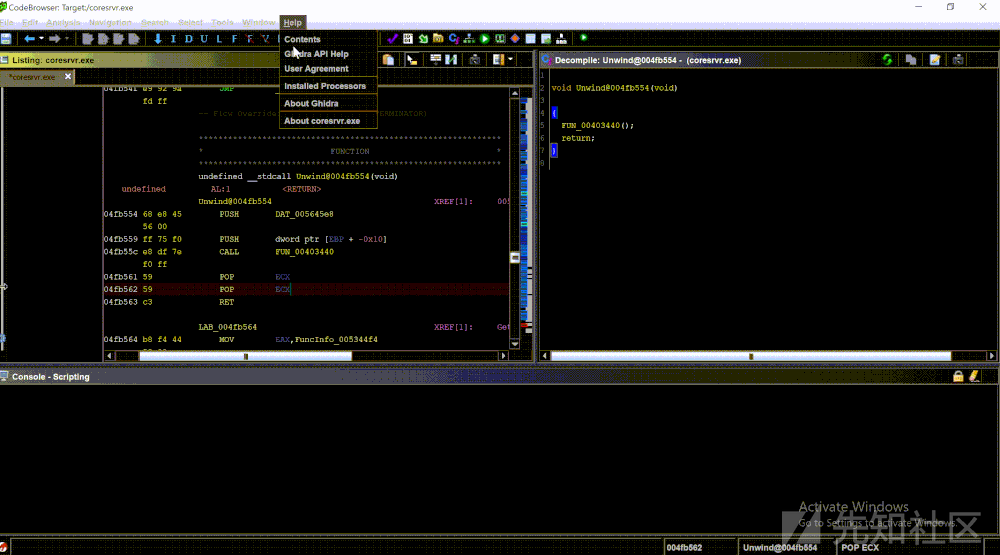
当Ghidra插件脚本运行时,程序的当前状态将是通过下面五个对象来处理的:
currentProgram:活动程序
currentAddress:工具中当前光标位置的地址
currentLocation:工具中当前光标位置的程序位置,如果程序位置不存在,则为null
currentSelection:工具中的当前选择,如果尚未选择,则为null
currentHighlight:工具中的当前高亮显示,如果没有进行高亮显示,则为null
值得注意的是,Ghidra是用Java编写的,所以,我们可以用Java或Jython来编写相应的插件。在本文中,我们将使用Jython来编写插件。我们可以通过三种方式来使用Ghidra的Jython API:
- 使用Python IDE(类似于IDA Python控制台):

- 从脚本管理器加载脚本:

- Headless方式——在不借助GUI的情况下使用Ghidra:

在了解了Ghidra插件方面的基础知识后,接下来,我们将通过脚本管理器(右键单击脚本 -> Edit with Basic Editor)来进一步研究源代码。

示例插件脚本位于/path_to_ghidra/ghidra/features/python/ghidra_scripts目录下。(在脚本管理器中,它们位于examples/python/目录下):

Ghidra插件的sink点检测
为了检测sink点,我们首先需要创建一个供插件使用的sink点列表。对于本文来说,我们的目标是已知的、会导致缓冲区溢出的sink点。这些sink点可以在各种文章、书籍和出版物中找到。
对于我们的插件来说,将首先查找程序中的所有函数调用,并对照sink点列表进行检查,以筛选出目标。对于每个sink点,我们将标识它们的所有父函数和调用地址。在这个过程结束时,我们将得到一个插件,可以将调用函数映射到sink点,从而识别处可能导致缓冲区溢出的sink点。
定位函数调用
我们可以通过多种方法来确定程序是否包含sink点。不过,在这里我们将侧重于以下方法,并在后文中详细加以介绍:
线性搜索——遍历二进制文件的正文段(text section,可执行段),并对照预定义的sink点列表检查指令操作数。
交叉引用(Xrefs)——利用Ghidra内置的交叉引用标识,来查询对于sink点的交叉引用。
线性搜索
定位程序中所有函数调用时,第一种方法就是进行顺序搜索。虽然这种方法可能不是最理想的搜索技术,但在演示Ghidra API中某些特性方面,却不失为一种很好的方法。
通过下面的代码,我们可以打印出程序中的所有指令:
listing = currentProgram.getListing() #get a Listing interface
ins_list = listing.getInstructions(1) #get an Instruction iterator
while ins_list.hasNext():             #go through each instruction and print it out to the console
    ins = ins_list.next()
    print (ins)
在CoreFtpServer上运行上述脚本将得到以下输出:

我们可以看到,该程序中的所有x86指令都被显示到控制台了。
接下来,我们要做的是对用于该程序的sink点进行过滤。重要的是,要检查重复项,因为可能存在多个对已标识sink点的引用。
在前面代码的基础上,我们可以获得以下代码:
sinks = [
         "strcpy",
         "memcpy",
         "gets",
         "memmove",
         "scanf",
         "lstrcpy",
         "strcpyW",
         #...
         ]
duplicate = []
listing = currentProgram.getListing()
ins_list = listing.getInstructions(1)
while ins_list.hasNext():
    ins = ins_list.next()
    ops = ins.getOpObjects(0)
    try:
        target_addr = ops[0]
        sink_func = listing.getFunctionAt(target_addr)
        sink_func_name = sink_func.getName()
        if sink_func_name in sinks and sink_func_name not in  duplicate:
            duplicate.append(sink_func_name)
            print (sink_func_name,target_addr)
    except:
        pass
现在,我们已经在目标二进制文件中找到了一个sink点列表,接下来,我们必须找到调用这些函数的位置。由于我们可以遍历二进制文件的可执行部分,并根据sink点列表来检查每个操作数,所以,只需为调用指令添加一个过滤器即可。
将该检查添加到前面代码中,我们将得到:
sinks = [
    "strcpy",
    "memcpy",
    "gets",
    "memmove",
    "scanf",
    "strcpyA",
    "strcpyW",
    "wcscpy",
    "_tcscpy",
    "_mbscpy",
    "StrCpy",
    "StrCpyA",
        "lstrcpyA",
        "lstrcpy",
        #...
    ]

duplicate = []
listing = currentProgram.getListing()
ins_list = listing.getInstructions(1)

#iterate through each instruction
while ins_list.hasNext():
    ins = ins_list.next()
    ops = ins.getOpObjects(0)
    mnemonic = ins.getMnemonicString()

    #check to see if the instruction is a call instruction
    if mnemonic == "CALL":
        try:
            target_addr = ops[0]
            sink_func = listing.getFunctionAt(target_addr)
            sink_func_name = sink_func.getName()
            #check to see if function being called is in the sinks list
            if sink_func_name in sinks and sink_func_name not in duplicate:
                duplicate.append(sink_func_name)
                print (sink_func_name,target_addr)
        except:
            pass
针对CoreFTPServer v1.2 build 505运行上述脚本,检测到的全部sink点如下所示:

不幸的是,上面的代码并没有检测到CoreFTPServer二进制文件中的任何sink点。但是,我们知道,这个特定版本的CoreFTPServer的确容易受到缓冲区溢出的攻击,并且包含sink点lstrcpyA。那么,为什么我们的插件没有检测到任何sink点呢?
经过一番研究之后,我们发现为了识别针对外部DLL的函数调用,我们需要使用专门处理外部函数的函数管理器。
为此,我们修改了代码,以便每次看到调用指令时,我们都会检查程序中的所有外部函数,并对照sink点列表进行检查。然后,如果在列表中找到了这些函数,我们就检查操作数是否与sink点的地址相匹配。
以下是脚本的修改部分:
sinks = [
    "strcpy",
    "memcpy",
    "gets",
    "memmove",
    "scanf",
    "strcpyA",
    "strcpyW",
    "wcscpy",
    "_tcscpy",
    "_mbscpy",
    "StrCpy",
    "StrCpyA",
        "lstrcpyA",
        "lstrcpy",
        #...
    ]

program_sinks = {}
listing = currentProgram.getListing()
ins_list = listing.getInstructions(1)
ext_fm = fm.getExternalFunctions()

#iterate through each of the external functions to build a dictionary
#of external functions and their addresses
while ext_fm.hasNext():
    ext_func = ext_fm.next()
    target_func = ext_func.getName()

    #if the function is a sink then add it's address to a dictionary
    if target_func in sinks:
        loc = ext_func.getExternalLocation()
        sink_addr = loc.getAddress()
        sink_func_name = loc.getLabel()
        program_sinks[sink_addr] = sink_func_name

#iterate through each instruction
while ins_list.hasNext():
    ins = ins_list.next()
    ops = ins.getOpObjects(0)
    mnemonic = ins.getMnemonicString()

    #check to see if the instruction is a call instruction
    if mnemonic == "CALL":
        try:
            #get address of operand
            target_addr = ops[0]
            #check to see if address exists in generated sink dictionary
            if program.sinks.get(target_addr):
                print (program_sinks[target_addr], target_addr,ins.getAddress())
        except:
            pass
利用修改后的脚本对我们的程序进行检查,我们发现了多个可能导致缓冲区溢出的sink点。

Xrefs
第二种更有效的方法是识别每个sink点的交叉引用,并检查哪些交叉引用正在调用列表中的sink点。由于此方法不会搜索整个正文段,因此效率更高。
使用以下代码,我们可以识别每个sink点的交叉引用:
sinks = [
    "strcpy",
    "memcpy",
    "gets",
    "memmove",
    "scanf",
    "strcpyA",
    "strcpyW",
    "wcscpy",
    "_tcscpy",
    "_mbscpy",
    "StrCpy",
    "StrCpyA",
        "lstrcpyA",
        "lstrcpy",
        #...
    ]

duplicate = []
func = getFirstFunction()

while func is not None:
    func_name = func.getName()

    #check if function name is in sinks list
    if func_name in sinks and func_name not in duplicate:
        duplicate.append(func_name)
        entry_point = func.getEntryPoint()
        references = getReferencesTo(entry_point)
    #print cross-references
        print(references)
    #set the function to the next function
    func = getFunctionAfter(func)
现在,我们已经找到了交叉引用,我们可以获得每个引用的指令并为调用指令添加一个过滤器。相应的代码如下所示:
sinks = [
    "strcpy",
    "memcpy",
    "gets",
    "memmove",
    "scanf",
    "strcpyA",
    "strcpyW",
    "wcscpy",
    "_tcscpy",
    "_mbscpy",
    "StrCpy",
    "StrCpyA",
        "lstrcpyA",
        "lstrcpy",
        #...
    ]

duplicate = []
fm = currentProgram.getFunctionManager()
ext_fm = fm.getExternalFunctions()

#iterate through each external function
while ext_fm.hasNext():
    ext_func = ext_fm.next()
    target_func = ext_func.getName()

    #check if the function is in our sinks list
    if target_func in sinks and target_func not in duplicate:
        duplicate.append(target_func)
        loc = ext_func.getExternalLocation()
        sink_func_addr = loc.getAddress()

        if sink_func_addr is None:
            sink_func_addr = ext_func.getEntryPoint()

        if sink_func_addr is not None:
            references = getReferencesTo(sink_func_addr)

            #iterate through all cross references to potential sink
            for ref in references:
                call_addr = ref.getFromAddress()
                ins = listing.getInstructionAt(call_addr)
                mnemonic = ins.getMnemonicString()

                #print the sink and address of the sink if
                #the instruction is a call instruction
                if mnemonic == “CALL”:
                    print (target_func,sink_func_addr,call_addr)
针对CoreFTPServer运行修改后的脚本,就会得到可能导致缓冲区溢出的sink点列表:

将调用函数映射到sink点
到目前为止,我们的Ghidra插件已经可以识别sink点。借助于这些信息,我们可以通过将调用函数映射到sink点来进行更深入的分析,以实现sink点与其输入数据之间的关系的可视化。在这里,我们将使用graphviz模块绘制图形。
把它们组合在一起,我们就可以得到以下代码:
from ghidra.program.model.address import Address
from ghidra.program.model.listing.CodeUnit import *
from ghidra.program.model.listing.Listing import *

import sys
import os

#get ghidra root directory
ghidra_default_dir = os.getcwd()

#get ghidra jython directory
jython_dir = os.path.join(ghidra_default_dir, "Ghidra", "Features", "Python", "lib", "Lib", "site-packages")

#insert jython directory into system path
sys.path.insert(0,jython_dir)

from beautifultable import BeautifulTable
from graphviz import Digraph


sinks = [
    "strcpy",
    "memcpy",
    "gets",
    "memmove",
    "scanf",
    "strcpyA",
    "strcpyW",
    "wcscpy",
    "_tcscpy",
    "_mbscpy",
    "StrCpy",
    "StrCpyA",
    "StrCpyW",
    "lstrcpy",
    "lstrcpyA",
    "lstrcpyW",
    #...
]

sink_dic = {}
duplicate = []
listing = currentProgram.getListing()
ins_list = listing.getInstructions(1)

#iterate over each instruction
while ins_list.hasNext():
    ins = ins_list.next()
    mnemonic = ins.getMnemonicString()
    ops = ins.getOpObjects(0)
    if mnemonic == "CALL":
        try:
            target_addr = ops[0]
            func_name = None

            if isinstance(target_addr,Address):
                code_unit = listing.getCodeUnitAt(target_addr)
                if code_unit is not None:
                    ref = code_unit.getExternalReference(0)
                    if ref is not None:
                        func_name = ref.getLabel()
                    else:
                        func = listing.getFunctionAt(target_addr)
                        func_name = func.getName()

            #check if function name is in our sinks list
            if func_name in sinks and func_name not in duplicate:
                duplicate.append(func_name)
                references = getReferencesTo(target_addr)
                for ref in references:
                    call_addr = ref.getFromAddress()
                    sink_addr = ops[0]
                    parent_func_name = getFunctionBefore(call_addr).getName()

                    #check sink dictionary for parent function name
                    if sink_dic.get(parent_func_name):
                        if sink_dic[parent_func_name].get(func_name):
                            if call_addr not in sink_dic[parent_func_name][func_name]['call_address']:
                                sink_dic[parent_func_name][func_name]['call_address'].append(call_addr)
                            else:
                                sink_dic[parent_func_name] = {func_name:{"address":sink_addr,"call_address":[call_addr]}}
                    else:
                        sink_dic[parent_func_name] = {func_name:{"address":sink_addr,"call_address":[call_addr]}}
        except:
            pass

#instantiate graphiz
graph = Digraph("ReferenceTree")
graph.graph_attr['rankdir'] = 'LR'
duplicate = 0

#Add sinks and parent functions to a graph
for parent_func_name,sink_func_list in sink_dic.items():
    #parent functions will be blue
    graph.node(parent_func_name,parent_func_name, style="filled",color="blue",fontcolor="white")
    for sink_name,sink_list in sink_func_list.items():
        #sinks will be colored red
        graph.node(sink_name,sink_name,style="filled", color="red",fontcolor="white")
        for call_addr in sink_list['call_address']:
        if duplicate != call_addr:
                graph.edge(parent_func_name,sink_name, label=call_addr.toString())
                duplicate = call_addr

ghidra_default_path = os.getcwd()
graph_output_file = os.path.join(ghidra_default_path, "sink_and_caller.gv")

#create the graph and view it using graphiz
graph.render(graph_output_file,view=True)
针对我们的程序运行该脚本,会得到以下图表:

我们可以看到调用函数以蓝色突出显示,而sink点以红色突出显示。调用函数的地址显示在指向sink点的代码行上。
在进行必要的手动分析后,我们发现,这个Ghidra插件识别出的几个sink点都产生了缓冲区溢出。WinDBG的以下屏幕截图表明,由于lstrcpyA函数调用,EIP被0x42424242覆盖了。

其他功能
虽然以图形方式显示结果有助于漏洞分析,但如果用户可以选择不同的输出格式,会更加方便。
Ghidra API提供了多种与用户交互的方法,以及多种输出数据的方法。我们可以利用Ghidra API让用户选择输出格式(例如文本、JSON、图形)并以所选格式显示结果。下面的示例显示了具有三种不同显示格式的下拉菜单。此外,完整的脚本可以在我们的github上找到:

局限性
Ghidra存在多个已知问题,例如,对于编写像我们这样的分析插件的一个最大问题是Ghidra API并不总能返回已识别标准函数的正确地址。
与IDA Pro不同,IDA Pro具有来自多个库的函数签名(FLIRT签名)数据库,可用于检测标准函数调用。但是,Ghidra仅为DLL提供了一些导出文件(类似于签名文件)。有时,标准库检测无法正常进行。

通过比较IDA Pro和Ghidra针对CoreFTPServer的反汇编输出,我们可以看到,IDA Pro的分析通过FLIRT签名成功地识别和映射了函数lstrcpyA,而Ghidra则显示了对函数lstrcpyA的内存地址的调用。
尽管Ghidra的公开版本存在某些局限性,但我们希望看到这些不足会得到改善,比如增强标准库分析功能,以进一步推动自动化漏洞研究。
小结
Ghidra是一个强大的逆向工程工具,可以用来识别潜在的漏洞。使用Ghidra的应用编程接口,我们能够开发插件来识别sink点及其父函数,并以各种形式显示结果。在我们的下一篇文章中,我们将使用Ghidra进行其他方面的自动化分析,并增强插件的漏洞检测能力。